

Key Takeaways
- Revenue operations KPIs provide a comprehensive view of how well cross-functional teams collaborate to drive revenue.
- These help identify areas where you can streamline processes and optimise resources to enhance efficiency.
- Metrics like adoption rate and customer lifetime value provide valuable data for anticipating future revenue streams, making informed strategic decisions, and driving sustainable growth.
Companies that don’t invest in their Revenue Operations (RevOps) teams have a problem: They’re already behind. RevOps experts are a critical part of the revenue engine, collaborating with sales to drive performance and increase revenue.
These teams are the connective tissue that unifies sales, marketing, and customer success toward an organisation’s revenue goals. They take charge of aligning cross-functional goals and coordinating strategies, helping to drive all teams toward consistent revenue growth and enable business transformation.
However, these teams can’t perform those essential duties without understanding what’s working and what isn’t. Measuring success—and failure—is a major responsibility of a RevOps team. Consistently monitoring and identifying areas of improvement, wisely allocating resources, and optimising performance are how businesses drive growth.
But these teams can’t measure everything. RevOps leaders need to redefine their KPIs to ensure they’re tracking the right metrics and understand what actually will help their business grow. Focusing on the right data is the only way to ensure cross-team alignment, communication, and collaboration, all of which impact revenue goals.
What Are Revenue Operations KPIs?
Revenue operations KPIs are key metrics used to assess the effectiveness and efficiency of an organisation’s revenue-generating processes in a specific period. Beyond just showing total revenue, these KPIs provide insights into how well your business performs with conversion rate, sales velocity, speeding up sales processes, and maintaining customer loyalty. They give you a clear picture of what’s working and where there might be room for improvement, allowing teams to develop better action plans aligning with strategic initiatives.
Why Are Revenue Operations KPIs Important?
KPIs are essential for driving business growth and alignment. They link your strategies to tangible, measurable results and provide insights into whether you’re hitting your targets. This allows you to make data-driven decisions to amp up your company’s revenue-generating capabilities.
For instance, if acquiring a new customer is too expensive, you can evaluate the ROI of marketing campaigns, reassess the sales process, and explore more cost-effective acquisition channels. You can also track the sales cycle length to identify bottlenecks, streamline workflows, and introduce automation to speed up deal closure.
On top of that, benchmarking KPIs against industry standards or competitors gives you a valuable perspective on where your company stands in the market. Understanding how your performance stacks up against industry leaders allows you to identify revenue operations best practices, adapt successful strategies, and set more realistic goals that drive competitive advantage.
Siloes in Metrics Disrupt Growth Opportunities
RevOps teams that know which numbers align with the broader picture for the business can enhance decision-making, giving leaders evidentiary support to make impactful change. They need to look at each category of metrics and think: How does this data impact revenue? What’s most meaningful to our goals and bottom line?
Alignment is key, and it starts with RevOps. RevOps teams are capable of collecting and analysing plenty of revenue-related data, but the numbers come from a multitude of siloed teams. Businesses rely on data to monitor progress and growth, but data without context of the bigger picture limits business evolution. Shared metrics, meanwhile, empower a RevOps team to show a business the path toward predictable revenue growth.
Shared measurement also allows RevOps teams to optimise. Data drives the ability to tweak and perfect different processes or to change team members’ behaviours. Prioritising the metrics deemed most important allows businesses to change where needed and to execute so the revenue engine is constantly well-oiled. Business survival depends on the state of that engine, meaning RevOps teams need full access to find what’s relevant. Cross-team collaboration makes that level of visibility possible.
Once gathered in a single source of truth, these low-level indicators of success or failure cover too much to be valuable for every business. Instead, RevOps leaders and teams must consider which of those metrics align with bigger business goals and select those as KPIs to drive growth.
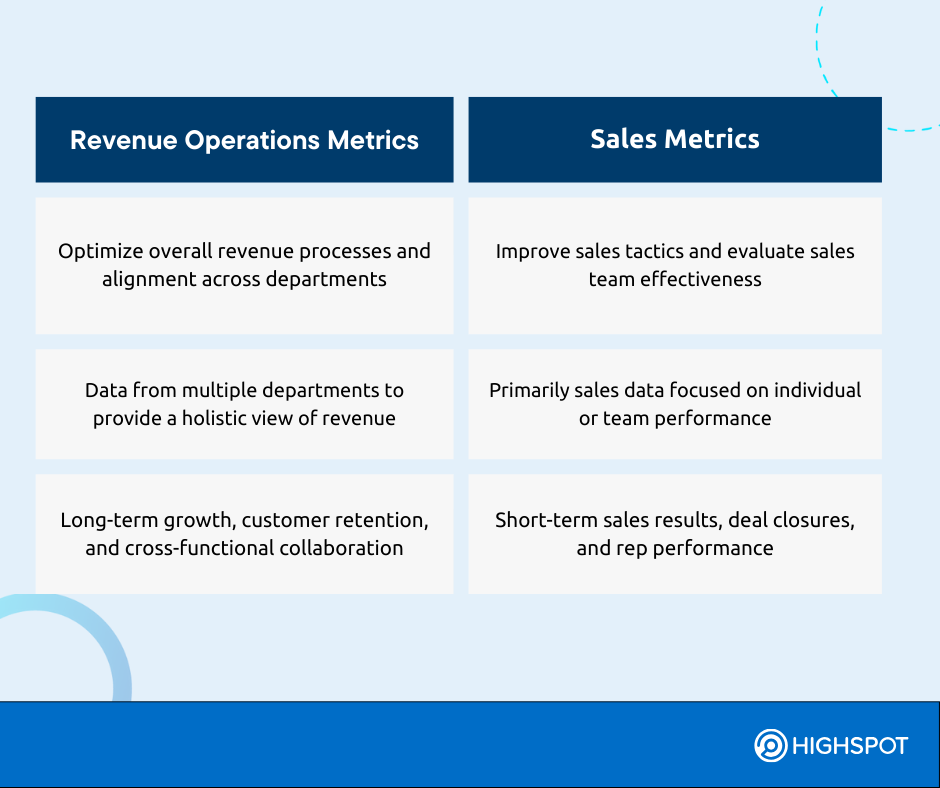
Revenue Operations Metrics vs Sales Metrics
Although there’s an overlap between RevOps and sales metrics, they serve distinct purposes. RevOps metrics focus on the bigger picture, looking at overall business performance, team alignment, and long-term customer relationships. In contrast, sales metrics zero in on individual sales performance, like quota attainment. They track specific sales team activities and sales rep performance within the broader revenue strategy.
Revenue Operations KPIs Every Team Should Track
RevOps teams have plenty of data to pull from: Revenue, sales, marketing, and customer success metrics can all be relevant to their work. Leaders need to think critically about which data and performance indicators impact their goals and bottom line. It’s up to RevOps to determine which of these are KPIs that can provide a path forward to predictable revenue growth.
Revenue Metrics
Revenue metrics are the bread and butter of a RevOps team. RevOps leaders need to align with other teams to see which makes the most sense and impact to track.
Revenue metrics boil down to just that: revenue. They measure how much is coming into a business, allowing RevOps teams to better determine where and how it can grow. For example, these metrics can include:
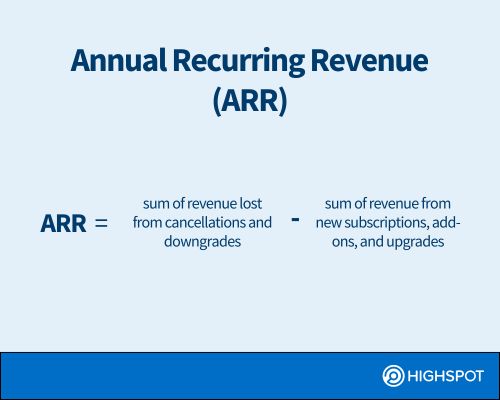
1. Annual Recurring Revenue (ARR)
ARR, or annual recurring revenue, is a common metric used by SaaS-based businesses. This can also be calculated as monthly recurring revenue (MRR).
ARR represents the amount of revenue that will come in annually for the life of the subscription or contract. This metric is recognised as a very important measurement for revenue operations professionals, with 51.3% of them emphasising its importance for engaging leadership. This is no surprise since ARR is predictable revenue.
For example, if you have 100 customers, each paying $1,000 annually, your ARR is $100,000.
Calculation: ARR = (sum of revenue from new subscriptions, add-ons, and upgrades) – (sum of revenue lost from cancellations and downgrades)
2. Conversion Rate
The conversion rate lets you know the percentage of your leads that turn into customers. If you have 200 leads and 5 become customers, your conversion rate is 2.5%. The optimal conversion rate varies by industry.
At first glance, this figure won’t reveal much. It doesn’t indicate whether your pricing is off, your product demo needs improvement, a mix of both, or something else. Revenue operations analyses the performance of your sales and marketing efforts, getting to the root of the problem and providing a solution.
Calculation: Conversion Rate = (Number of conversions/number of leads) x 100
3. Net Revenue Retention Rate (NRR)
NRR captures every shift in recurring revenue, factoring in upsells and churn. It gives you a full picture of how your revenue evolves over time, showing how effectively you’re retaining customers and growing revenue. This also helps you understand why customers quit using your products or services.
According to Bain & Company, a 5% increase in customer retention can boost profits by over 25%. Your loyal customers will typically buy more over time. Plus, happy customers often refer others and are willing to pay a higher rate to stick with a company they trust rather than switching to a less familiar competitor. This reduces your operating costs.
Calculation: NRR = [(Revenue at start + Expansion Revenue – Churned Revenue) / Revenue at start] x 100
4. Customer Lifetime Value (CLV)
CLV estimates the total customer revenue you can expect over their lifetime. This helps you make the most of each existing customer rather than focusing solely on acquiring new ones, which is more expensive. Knowing their average value gives you the opportunity to increase revenue through upselling, cross-selling, or renewal.
For example, if a customer spends $10,000 per purchase, buys twice a year, and stays for five years, their CLV is $100,000.
Calculation: CLV = Average Order Value x Purchase Frequency Rate x Average Customer Lifespan
Levelling Up
Organisations leveraging a unified system can use our initiative scorecards to track initiative revenue, offering insight into how teams can course-correct lagging indicators across teams and metrics. These scorecards can measure initiative performance to uplevel your revenue metrics.
Sales Metrics
Sales metrics measure the performance of a business’ actual sellers. These can help leaders understand which behaviours their teams should be driving, and how those ladder up to larger business initiatives. Although sales metrics overlap often with revenue and enablement data, this data focuses on the reps themselves. Understanding these metrics can help a RevOps team do more with less.
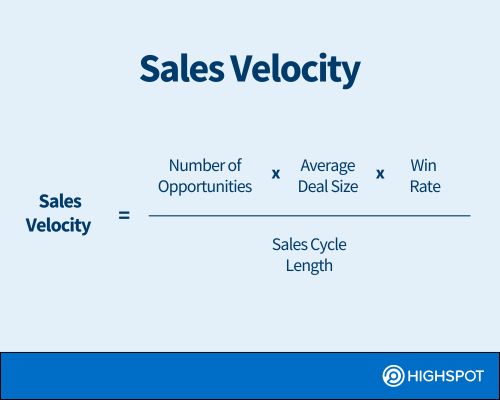
5. Sales Pipeline Velocity
Sales velocity shows how quickly sales opportunities move through the sales pipeline and result in closed deals. A higher sales velocity means you have successful sales strategies, high-quality leads, efficient sales processes, and your team is consistently moving leads through the sales funnel. The ‘health’ of sales velocity is dependent on the type of product or service your sales team is selling.
If you aim to move leads faster through the sales funnel, consider running A/B tests on marketing content to find out what works best. Find ways to streamline your sales operations and improve customer service.
Calculation: Sales Velocity = (Number of Opportunities x Deal Size x Win Rate) / Sales Cycle Length
6. Customer Churn
The customer churn rate tracks the percentage of customers who stop doing business with you for any reason. The lower this number, the better. A lower churn rate signals higher customer satisfaction and retention. On the flip side, a high churn rate might point to a poor onboarding process, ineffective loyalty programmes, or better alternatives from competitors.
Calculation: Customer Churn Rate = (Customers lost during a period / Total customers at the start of the period) x 100
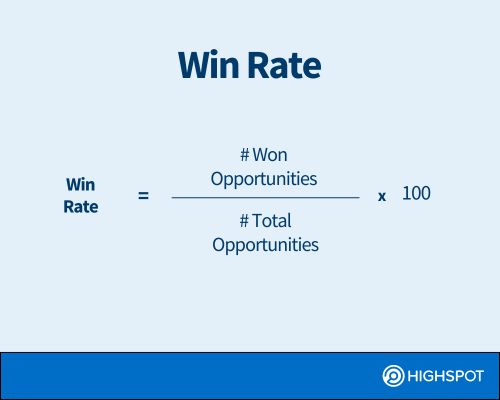
7. Win Rate
Win rate tracks how many sales opportunities turn into actual sales. It reflects how well your sales team is doing, showing where they shine and where they might need to step up their game.
For example, if you closed 20 out of 50 deals, your win rate is 40%.
Calculation: Win Rate = (Number of Deals Won / Total Number of Deals) x 100
8. Average Deal Size
The average deal size is the average value of each closed deal. Knowing this will help you understand the financial impact of your sales efforts. Upselling, cross-selling, and value-based selling can help increase the average deal size.
Calculation: Average Deal Size = Total Revenue from Deals / Number of Deals Closed
Levelling Up
Sales rep scorecards leverage your unified system’s data and metrics to indicate advanced metrics, identifying top performers by training and content usage.
Marketing Metrics
Marketing aids in pipeline generation, which leads to closed deals. By measuring the impact of these investments, RevOps leaders can better understand how to allocate resources and where they’re seeing worthwhile ROI.
Marketing metrics help RevOps teams understand how well they’re attracting prospects. They can include:
9. Customer Acquisition Cost (CAC)
Customer acquisition cost (CAC) refers to the total cost involved in acquiring a new customer. This encompasses sales and marketing expenses, property, equipment, and human resources.
CAC allows for smarter decision-making by providing insights into the revenue your company gains from new customers and how long it takes to recoup the costs of acquiring a customer and start making a profit.
For instance, if you spent $100,000 on marketing and sales and acquired 100 new customers, your CAC would be $1,000.
Calculation: CAC = Total Sales and Marketing Costs / Number of New Customers Acquired
10. Marketing Qualified Lead
Calculating MQLs isn’t a simple, fixed formula—it requires defining clear criteria based on both behavioural engagement and demographic fit. These can be based on actions like attending a webinar, downloading content, or requesting a demo, along with attributes such as job title, company size, and industry.
Using lead scoring helps automate this process by assigning points to specific actions and attributes, making it easier to calculate and track MQLs. Tracking MQLs effectively helps ensure that marketing is delivering high-quality leads that are more likely to convert into customers, allowing the sales team to focus on the most promising opportunities.
11. Click Through Rate
Click-through rate (CTR) refers to the percentage of people who click on a link (e.g., an ad, email link) after seeing it. By analysing CTR, you can identify whether or not your ad is resonating, the effectiveness of your campaign, and whether messaging is targeting the right audience.
Calculation: CTR = Clicks / Impressions × 100
12. Cost Per Lead
Cost per lead (CPL) is a crucial metric that helps businesses analyse the efficiency and profitability of their marketing campaigns in generating potential customers. It provides insight into how much you are spending to acquire a lead, which can inform decisions about budget allocation, strategy optimisation, and overall campaign performance.
Calculation: CPL = Total Marketing Spend / Number of Leads
Levelling Up
Content scorecards can help measure the success and impact of your content to share message delivery rate, then draw a line to how those metrics impact overall business outcomes.
Customer Success Metrics
The majority of repeat customers spend more than new prospects. Measuring the happiness of existing customers can improve retention rates and increase referrals. Which of the numbers to focus on from a revenue perspective depends on where a business is putting its investments.
Customer success metrics analyse the ability of a business to maintain customer relationships, renew contracts, and sustain existing business. They include:
13. Adoption Rate
The adoption rate measures how frequently customers use your product or service after signing up and highlights which features are most popular. High adoption rates indicate that your solution is a success and that customers see value. It also helps refine your sales forecasting by providing insights into customer engagement.
Calculation: Adoption Rate = (Number of Users Adopting Product / Total Number of Users) x 100
14. Net Promoter Score
NPS can help you gauge loyalty and satisfaction by measuring how likely customers are to recommend your product or service to others. This can guide your strategy for product development, customer experience improvements, and overall revenue growth.
Based on their answers, customers fall into three categories:
- Promoters (9-10): Enthusiastic supporters who are likely to promote your brand.
- Passives (7-8): Satisfied but not particularly enthusiastic customers.
- Detractors (0-6): Unhappy customers who might discourage others from using your product or service.
From there, you can calculate the percentage of promoters and detractors:
- Percentage of Promoters: (Number of Promoters / Total Number of Respondents) × 100
- Percentage of Detractors: (Number of Detractors / Total Number of Respondents) × 100
Then, apply the formula for NPS:
NPS = Percentage of Promoters − Percentage of Detractors
15. Customer Satisfaction
Tracking CSAT allows you to analyse several key aspects of your customer experience, product, and service quality. CSAT is a direct measure of how happy or satisfied customers are with a specific interaction, product, or service. Typically gathered through surveys, CSAT scores provide valuable insights into how well your company is meeting customer expectations and where improvements can be made.
Calculation: CSAT = Number of Satisfied Customers (rating 4-5) / Total Number of Survey Responses × 100
16. Expansion
What it measures: The additional revenue generated from existing customers through upsells, cross-sells, or increased usage.
Calculation: Expansion Revenue = Revenue from Upsells + Cross-sells + Upgrades
RevOps KPIs guide revenue growth
Productivity, forecasting, and company growth — these all rely on RevOps metrics. They let a business do more with less at a time when resources and budgets are tighter than ever.
So how can RevOps teams identify the KPIs that make a difference? By revisiting company goals. Here’s how you can further align revenue operations KPIs with business goals:
Identify your North Star
A North Star metric is a measurable KPI that is a reference point that keeps your team focused. For example, if your North Star is to be number one in your industry for customer experience, your KPI might be achieving the highest net promoter score (NPS).
Set SMART goals
Work with the sales, customer success, marketing teams, and stakeholders to define Specific, Measurable, Achievable, Relevant, and Time-bound goals that support your revenue objectives. A SMART goal could be to increase annual recurring revenue (ARR) by 20% within the next 12 months by improving customer retention and upsell strategies. This goal is:
- Specific (increase ARR)
- Measurable (by 20%)
- Achievable (with retention and upsell)
- Relevant (supports revenue growth)
- Time-bound (within 12 months)
Align sales, marketing, and customer success teams to revenue goals and strategic initiatives
This will get all teams working towards the same revenue targets. For example, if your revenue goal is to increase customer lifetime value (CLV), sales might focus on upsells, marketing targets high-value leads, and customer success works on retention strategies. When these teams align their efforts, the unified approach maximises revenue potential.
A comprehensive sales enablement platform can further support this alignment by providing a centralised hub for tracking KPIs, sharing insights, and coordinating efforts across teams. This ensures that everyone has the information they need to execute their strategies effectively.
Identify relevant KPIs
Focus on the KPIs that truly matter for your specific goals, cutting through the noise to track what’s most impactful. While some metrics are standard across companies, focus on those that truly reflect your unique organisation.
Remember, KPIs should evolve as your revenue operations strategy and the market change, so regularly update them to keep your measurements relevant. For example, if you focus on long-term customer relationships, a KPI like customer lifetime value (CLV) would be more appropriate than tracking lead generation numbers.
Measure, Analyse, Optimise
Regularly measure your KPIs, analyse the results, and adjust to keep RevOps on track. To do this, set up a routine for reviewing weekly, monthly, or quarterly KPI data, depending on your business cycle. Use dashboards to visualise real-time trends and identify improvement opportunities. You can even test new strategies and monitor dashboard changes. For example, if you notice a drop in sales velocity, analyse the sales process, identify bottlenecks, and implement sales enablement, onboarding, and training to fix the performance problem.
Measurement and Optimisation Make Growth Possible
Successfully redefining KPIs requires continuous measurement. Tracking regularly is the only way to check performance and success. It’s a team sport; breaking down the siloes between teams equips RevOps with the tools to track performance and optimise it, opening a path toward predictable revenue growth.
At a time when all businesses need to do more with less, RevOps’s ability to better measure success means everything. 37% of business leaders say increasing revenue while minimising costs is their greatest challenge. Yet both of these concepts are achievable when organisations track the right metrics and KPIs, and optimise the corresponding operations.
RevOps leaders have the incredible opportunity to make a significant impact on their businesses. It’s their goal and reason for being: to turbo-charge a company’s profits and make room for evolution. That starts with knowing what works and what doesn’t. Through that understanding, the opportunity to drive change and achieve business growth isn’t impossible. It’s unmissable.
Learn how to drive next-level growth with Highspot’s enablement for Revenue Operations.